Post-school labour-market outcomes of school-based NCEA
Publication Details
This report presents some basic statistics on what happens to school leavers in the first few years after school, and what difference school-based NCEA makes on post-school labour market outcomes.
Author(s): David Scott, Tertiary Sector Performance Analysis, Ministry of Education.
Date Published: September 2018
Page Contents:
- Summary
- Where school leavers go post-school
- For those not overseas, how many go to work, further education or neither?
- How much does school achievement matter?
- Choosing tertiary study in an institution
- Doing formal tertiary training on the job
- How school achievement relates with tertiary achievement
- Choosing work
- Not in employment, education or training
- Trends from 2009 to 2015
- What do school leavers earn?
- Cumulative earnings returns for different levels of school achievement
- How does tertiary achievement mitigate earnings of those with low school achievement?
- More info
Summary
Every year around 60,000 young people leave school and face choices about what to do next.
Around 55% choose tertiary study as their main activity in the year after school while 28% choose work, and 6% head overseas. Seven years later 56% are working, 17% are still in study, and 17% have gone overseas. Not being in employment or further education or training (NEET) is the main activity for between 15%-17% of school leavers.
It is important to complete a qualification.
There are significant and persistent disadvantages for those that don’t achieve any school qualifications. Over 40% never engage in employment or any further education or training. One in three will gain a tertiary qualification but mostly at Level 1-4. Their employment rates just exceed 40% after 7 years, and as a group, their average earnings after 7 years at $18,000, are 40% less than those of the NCEA 1 group. Further analysis is needed to assess the extent to which this still holds once adjusted for differences in underlying demographic- or study-related characteristics, but in actual unadjusted terms, this is the average picture today for over 1 in 10 (or 6,000-7,000) young people leaving school each year.
NCEA 1 still provides some benefits as a direct pathway to the labour market.
A one-year upper secondary qualification (such as NCEA 1) is rare amongst OECD countries. While the number leaving with this level has been reducing, it still represents around one in 10 school leavers annually. Leavers with NCEA 1 have just as much chance finding work and earning as much as their non-UE NCEA 2 or 3 peers, at least initially. However, after 7 years a clear differentiation is re-established, and NCEA 1 leavers are 10% less likely to be employed, and their earnings are about 15% less than their peers with NECA 2. Leavers with NCEA 1, while half as likely to be in NEET as those with no school achievement, are nearly twice as likely to be in NEET as their NCEA 2 or 3 peers.
But NCEA 2 is better.
Around 16,000 people (or 26%) leave school with NCEA 2 or equivalent, and a further 7,500 (12%) leave with NCEA 3 or equivalent but without University Entrance (UE). Level 2 leavers are slightly more likely to go direct to work than their Level 3 peers who are slightly more likely to enrol in a tertiary institution. Non-UE NCEA 3 leavers on average have higher (5% more) earnings than their NCEA 2 peers after 7 years. However, this NCEA 3 group as a whole is more tertiary qualified. When non-UE NCEA 2 and NCEA 3 people with the same tertiary qualifications are compared, NCEA Level 2 leavers earn more than their NCEA 3 peers, at every level of tertiary attainment, and particularly so at vocational Levels 3-4, and at diploma level. At least over the 7 year post-school window of data available.
NCEA 3 with UE.
Around 25,000 people (40%) each year leave with University Entrance. Most (over 80%) go on to institution-based tertiary study. The earnings of those with UE who forgo employment initially for tertiary study, will overtake the earnings of all their less-qualified peer groups five years after leaving school. By year 7, the average earnings for the UE group is 28% higher than those of the NCEA 2 group. However, the average total earnings accumulated by the UE group over 7 years ($172,000) is still below that of the non-UE Level 2 or 3 groups who have accumulated on average $180,000 of earnings. Though, at their current growth rate these are likely to be overtaken by the UE group within one more year.
Education has a stronger effect on employment rates than on earnings , consistent with previous research suggesting a relatively compressed earnings dispersion by education level in New Zealand.
For those leaving school with less than UE, there is evidence to support the message that even low levels of tertiary achievement can significantly help reduce the effects of low school achievement on employment and earnings. However, with the exception of the Level 3 (no UE) group, the association between higher school achievement and higher earnings still remains, for people with the same level of tertiary attainment.
Where school leavers go post school
In this report, school achievement relates to both NCEA and non-NCEA school qualifications. However, these latter represent less than 5% of school qualifications, so the analysis here should provide a reasonable proxy for NCEA. This report mostly follows those students who left school in 2009. This year has been chosen as it provides the most years of post-school follow-up that are currently available in the data. As this was during a major global economic downturn, trends are also provided to compare outcomes with later cohorts. This report uses a method to estimate what the student’s main destination was for a year, recognising that in reality students engage in multiple and different activities over a year.
It is important to note that associations between education and labour market outcomes, while suggestive or indicative, do not prove that a certain level of educational achievement causes or leads to the level of outcome it is associated with. There may be other factors (for example, personality traits) that are contributing independently to both the education and labour market outcomes seen.
For those leaving in 2009:
- 55% went directly to formal education and training in the following year:
- 51% to a tertiary institution, and
- 4% to work-based training.
- 28% went directly to work, including 4% also doing work-based training.
- 17% were still in education 7 years later, including 5% in work-based training.
- While 56% of the leavers were working in NZ 7 years later.
- Between 15% and 16% of leavers were not in employment, education or training (NEET). This level remained similar across the 7 years of available post-school data.
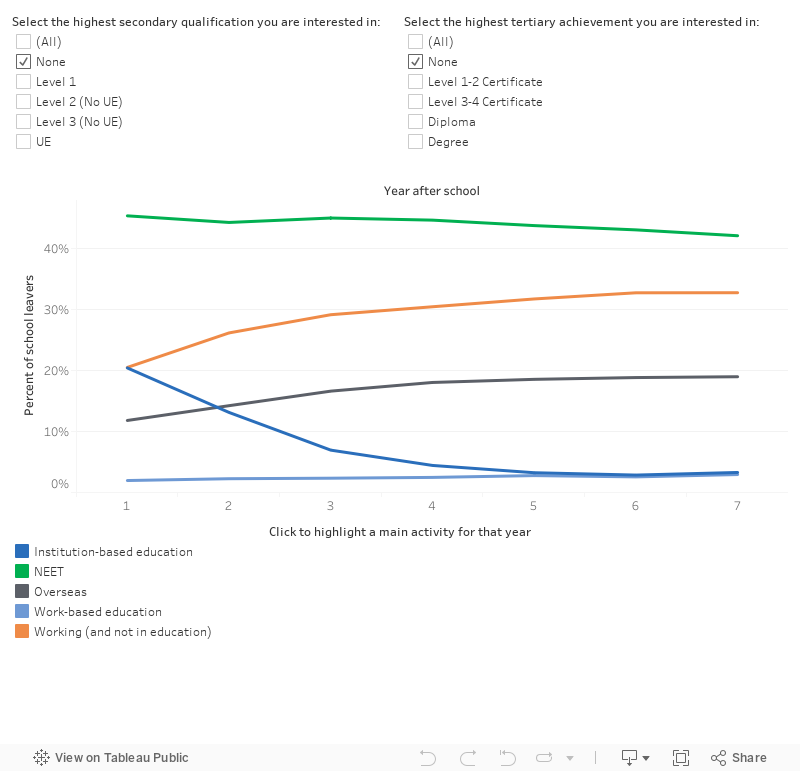
Figure 1: Main activity post-school for 2009 school leavers
For those not overseas, how many go to work further education or neither?
- Over one in 20 leavers (6%), have overseas as their main destination in the year after school. After 7 years, one in 6 have (17%).
- We don’t know how many of these take up further education or work, but for those remaining in NZ:
- 58% were in formal education or training the year after school
- 20% were there after 7 years.
- The employment rate of NZ-based school leavers was 29% in the first year, increasing to 67% after 7 years.
- NEET rates were persistent between 17% and 19% over the first 7 years after leaving school.
Figure 2: Main activity for leavers based in New Zealand

How much does school achievement matter?
- 82% of those with UE enrol directly in a tertiary institution, while 80% of all tertiary students have at least NCEA 2.
- Excluding UE, every year of NCEA achievement raises direct participation in tertiary by 5%.
- Non UE-leavers with NCEA 1, 2 or 3 are equally likely as each other, and are more likely than other groups, to be doing formal work-based training.
- Non UE-leavers with NCEA 1, 2 or 3 are equally likely as each other, and more likely than other groups to go directly to work after leaving school, but as time passes, the education gradient re-establishes itself, as students complete their tertiary studies and enter the market, and work experience plays a bigger factor.
- School achievement has a particularly strong relationship with NEET. Two in five NZ-based leavers with no school achievement do not work or engage in further education or training, and this level persists over subsequent leaving cohorts, and reduces only a little in later cohorts as the global financial crisis passed.
- People with low or no school achievement are more likely to go overseas straight after school, but as time passes, those with higher school achievement are more likely to head overseas, as they complete tertiary study or some work experience.
Figure 3: One year after leaving school

Figure 4: Seven years after leaving school

Choosing tertiary study in an institution
- Most leavers with UE (over 80%) go on to institution-based tertiary study either at degree level or below. And over 80% of leavers engaging in further study have NCEA 2 or higher.
- Perhaps not surprisingly, given the purpose of NCEA 1, there is no difference in the rate that leavers with NCEA 1 do further institution-based study compared to those leavers with no school qualification. This is not the case with workplace-based tertiary training (see below).
- Interestingly, for higher levels of school achievement, while there are substantial participation gaps initially, these gaps converge to within 6 percentage points after 7 years.
Figure 5: School leavers choosing institution-based tertiary study

Doing formal tertiary training on the job
- Between 4,000 and 5,000 school leavers engage in this option at some stage during the 7 years after school (around 7%-8% of leavers). Workplace-based training here includes both apprenticeship programmes as well as other industry trainee programmes.
- Involvement in work-based tertiary education follows a different pattern to participation in institution-based tertiary education.
- Participation is strongest for NCEA 2, NCEA 1 and NCEA 3 in that order.
- Participation starts initially at 4%, increasing to 8% in year 4, before falling back to 6% by year 7. However for those with NCEA 1 or 2 school achievement, participation peaks at 14% in year 4 after leaving school.
- There are around 600 (or 3%) of UE holders choosing this option as the main activity at some stage in the 7 years after leaving school.
Figure 6: School leavers in workplace-based tertiary training

How school achievement relates with tertiary achievement
- 62% of all students leaving school in 2009 had obtained a tertiary qualification after 7 years.
- There is a predictable positive relationship between level of school achievement and level of tertiary achievement.
- After 7 years, around 5% gain a tertiary qualification at Level 1 or 2, a similar level on the framework to their school qualification.
| School achievement | Highest tertiary achievement after 7 years | |||||
|---|---|---|---|---|---|---|
| None | Level 1-2 | Level 3-4 | Diploma | Degree | Total | |
| None | 63% | 9% | 22% | 3% | 2% | 100% |
| Level 1 | 50% | 8% | 33% | 6% | 3% | 100% |
| Level 2 (no UE) | 38% | 6% | 34% | 11% | 11% | 100% |
| Level 3 (no UE) | 33% | 5% | 32% | 14% | 17% | 100% |
| UE | 21% | 1% | 6% | 5% | 66% | 100% |
| Total | 38% | 5% | 21% | 7% | 29% | 100% |
Figure 7: The tertiary achievement of school leavers after seven years by their school achievement

Choosing work
- There is an expected pattern for those with UE who forgo work initially for tertiary study, but who then move into the labour market and overtake their less qualified peers; within 1 year (for those with no qualifications), within 2 years (for those Level 1 or 2), and within 3 years (for those with Level 3).
- However, for those without UE, there is no difference in initial employment rates for NCEA 1, 2 or 3.Though, there is a gradual widening after 3 or 4 years, reflecting subsequently acquired tertiary skills or qualifications, and selection effects through ability and work experience etc.
- The data again highlights the importance of getting some school qualification. Employment rates never reach 50% for those that don’t. Even leavers with NCEA 1 are 30% to 40% more likely to be in work.
Year after school | None | Level 1 | Level 2 (no UE) | Level 3 (no UE) | UE |
|---|---|---|---|---|---|
1 | 0.57 | 0.95 | 1.00 | 0.97 | 0.35 |
2 | 0.65 | 1.02 | 1.00 | 0.96 | 0.30 |
3 | 0.70 | 1.02 | 1.00 | 0.97 | 0.32 |
4 | 0.72 | 1.01 | 1.00 | 0.99 | 0.61 |
5 | 0.70 | 0.96 | 1.00 | 1.05 | 0.94 |
6 | 0.70 | 0.93 | 1.00 | 1.04 | 1.08 |
7 | 0.68 | 0.90 | 1.00 | 1.04 | 1.14 |
Figure 8: School leaver employment rates

Not in employment, education or training1
- Your chances of not being in employment, education or training (NEET) are associated to your level of school achievement.
- The long-known message of disadvantage for those with no achievement is again shown here.
- While NEET rates are lower for those with higher school achievement, there is still a significant minority of higher-school-qualified young people in NEET given their higher numbers in the cohort of young people leaving school each year.
- A feature of NEET rates is that levels remain fairly constant for the cohort from year to year, rising slightly only for those with UE, presumably as some come out of study and remain in NZ with no work.
Figure 9: School leavers not in employment, education or training

- Note these rates differ slightly from the official NEET rate published by Statistics New Zealand, due to data sources and measurement differences.
Trends from 2009 to 2015
School leavers in 2009 were in the middle of a global financial crisis. Unemployment was rising and the economy and labour market were in recession. Research shows that in economic downturns it is the youngest and the least qualified that feel the adverse effects first and hardest, as employers look to delay recruitment and make layoffs. Traditionally in such times, research tends to show that people whose employment prospects are likely to suffer, tend to stay on in education, either doing an extra year in school, or choosing to enrol or re-enrol in tertiary study.
Figure 10: Into a tertiary institution the year after leaving school for cohorts leaving school 2009-2015

Figure 11: Into work the year after leaving school for cohorts leaving school 2009-2015

The figures above show first-year movements into work or study for seven leaving cohorts from 2009 through to 2015. Over the period 2010 to 2012 we see an expected increase in tertiary enrolment from school leavers, offset by a corresponding decrease in employment. This continued until 2013 when an improving labour market seemed to show two effects. Those non-UE holders with Level 2 or Level 3 increasingly chose employment and tertiary participation fell back. However, leavers with no or Level 1 qualifications remained roughly at 2013 employment levels for the next three years, with even a small pick-up in tertiary study.School leavers with UE remained relatively unaffected, despite a policy change in 2014 making it harder to obtain UE. We see a small dip in tertiary enrolment in the year introduced, and a corresponding rise in employment, which then has since returned to pre-change levels.
Figure 12: In NZ but not in employment, education or training in the year after leaving school

NEET rates rose for the least qualified group (No achievement or NCEA 1 only) until 2012, then fell back to pre-recession levels.NEET rates remained largely unchanged for all other leaver achievement groups.Similarly the first few years of the recession saw a rise in leavers going overseas, especially those with the least school achievement. However from 2013, as economy recovered we saw fewer school leavers going overseas, with rates for those with Level 2 and above falling back to pre-recession levels, while rates for Level 1 or no school achievement remain higher than before the recession.
What do school leavers earn?
Differences in school achievement affect earnings in two ways; people with lower achievement are less likely to be working and, if are they are working, they are more likely to be earning less than someone with higher achievement.
This can be seen in the two graphs shown. The first graph shows the average monthly earnings of all 2009 NZ-based school leavers, regardless of whether they were working or not. The second graph shows earnings for only those in employment.
The graphs show a relatively compressed earnings dispersion for workers, suggestive that education has a stronger effect on employment than on earnings.
In either case, the relationship between school achievement and earnings follows a similar pattern as with employment rates. Those with UE who forgo employment for tertiary study will overtake all groups by the end of the fifth year after leaving school, and by year 7 the average earnings for the UE group will be 28% higher than those of the Level 2 group.
Figure 13: Average monthly earnings for NZ-based school leavers (workers plus non-workers)

Figure 14: Average monthly earnings for NZ-based school leavers (workers only)

Group | Year 1 | Year 7 |
|---|---|---|
No school achievement | 0.47 | 0.52 |
Level 1 | 0.87 | 0.83 |
Level 2 (No UE) | 1.00 | 1.00 |
Level 3 (No UE) | 0.97 | 1.05 |
UE | 0.56 | 1.28 |
Group | Year 1 | Year 7 |
|---|---|---|
No school achievement | 0.92 | 0.84 |
Level 1 | 1.00 | 0.95 |
Level 2 (No UE) | 1.00 | 1.00 |
Level 3 (No UE) | 0.97 | 1.02 |
UE | 0.83 | 1.17 |
Cumulative earnings returns for different levels of school achievement
School leavers choosing further study over going direct to work do so on the expectation that they will eventually, on average, benefit significantly from higher earnings after study.
However, and for longer qualifications in particular, they forgo a number of years of cumulated earnings, and up to recently at least, have had to also contribute significant tuition costs.
When does the cumulative earned income of higher educated groups catch up to those who have been working longer?
We currently only have 7 years to track this. The graph shows the average cumulative earnings of any 2009 school leaver, regardless of whether they were working or not (but provided they were in NZ).
The group with NCEA 2 or 3 school achievement (without UE) have accumulated around $180,000 of earnings in the 7 years since leaving school. The UE group, a little less at $172,000, but growing at a rate to likely overtake within one more year.
While there is not much difference between earnings for Non-UE NCEA 2 and 3 groups, those with NCEA 1 school achievement have earned 15% less, and those with no achievement are earning 51% less, than their NCEA 2 peers.
Figure 15: Cumulative earnings for NZ-based school leavers (workers plus non-workers)

All leavers working or not (but based in NZ) | ||
|---|---|---|
Group | Year 1 | Year 7 |
No school achievement | 0.47 | 0.49 |
Level 1 | 0.87 | 0.85 |
Level 2 (No UE) | 1.00 | 1.00 |
Level 3 (No UE) | 0.97 | 1.03 |
UE | 0.57 | 0.94 |
How does tertiary achievement mitigate earnings of those with low school achievement?
- Tertiary achievement in general has a bigger impact on earnings than school achievement.
- There is less difference in earnings between Level 3 and 4 certificates, and diplomas.
- Leavers with Level 2 school achievement earn more than those with Level 3 (no UE) for any level of subsequent tertiary achievement.
- Level 2 also earn more than their peers with UE in some cases – where the latter subsequently gain a tertiary qualification below diploma level.
- For those leaving school with less than UE, there is evidence to support the message that even low levels of tertiary achievement can significantly help reduce the effects of low school achievement on employment and earnings.
- However, with the exception of the Level 3 (No UE) group, the association between higher school achievement and higher earnings still remains even with subsequent tertiary attainment.
Figure 16: Annual average earnings after seven years for NZ-based people who left school in 2009

Highest school achievement | Highest tertiary achievement | ||||
|---|---|---|---|---|---|
None | Level 1-2 | Level 3-4 | Diploma | Degree+ | |
None | 0.71 | 1.20 | 1.48 | 1.64 | 1.78 |
Level 1 | 0.83 | 1.39 | 1.58 | 1.65 | 1.83 |
Level 2 (No UE) | 1.00 | 1.47 | 1.74 | 1.74 | 1.99 |
Level 3 (No UE) | 0.96 | 1.25 | 1.45 | 1.62 | 1.76 |
UE | 1.61 | 1.35 | 1.66 | 1.75 | 2.19 |
More info
For more information including technical or definitional information contact tertiary.information@education.govt.nz
This report uses data from Statistics New Zealand’s Integrated Data Infrastructure (IDI). Use of this data requires the following disclaimer to be added to any output:
The results in this report are not official statistics. They have been created for research purposes from the Integrated Data Infrastructure (IDI), managed by Statistics New Zealand.
The opinions, findings, recommendations, and conclusions expressed in this report are those of the author(s), not Statistics NZ, or any other agency whose data has been used.
Access to the anonymised data used in this study was provided by Statistics NZ under the security and confidentiality provisions of the Statistics Act 1975. Only people authorised by the Statistics Act 1975 are allowed to see data about a particular person, household, business, or organisation, and the results in this report have been confidentialised to protect these groups from identification and to keep their data safe.
Careful consideration has been given to privacy, security, and confidentiality issues associated with using administrative and survey data in the IDI. Further detail can be found in the Privacy assessment for the Integrated Data Infrastructure available from www.stats.govt.nz.
Contact us
For more information about the content on this webpage, please email the Tertiary Mailbox