Survey of Adult Skills: Regional and local profiles Publications
Publication Details
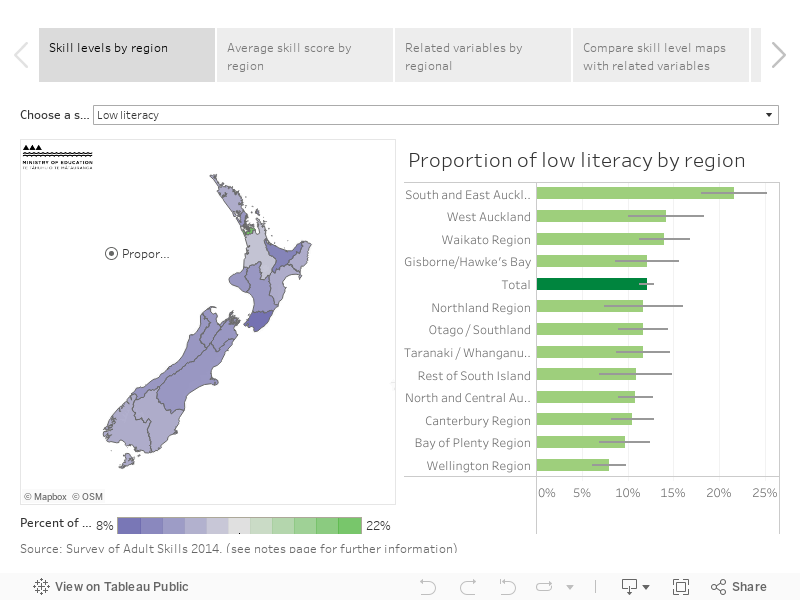
We have developed a visual tool that shows distribution of literacy, numeracy and problem-solving skills across the country by region and territorial authority. The tool also includes information on related variables, namely: qualification levels, use of ICT at work and having English as a first language. The last variable is important as the Survey of Adult Skills only tests skills in English. It shows that the region with the lowest skills is South and East Auckland, while Wellington has the highest skills. The low skill levels in South and East Auckland is largely driven by the high proportion of the population for whom English is not a first language. The higher skills in Wellington are largely related to qualification levels and a higher proportion of jobs requiring ICT use. Wellington is similar to North and Central Auckland on both of these variables. However, North and Central Auckland has a higher proportion of the population for whom English is not a first language.
Author(s): Dee Earle, Tertiary, Ministry of Education
Date Published: December 2018 | Last Updated: November 2019
Survey of Adult Skills: regional and local profiles
The Survey of Adult Skills measures the skills of New Zealand adults in literacy, numeracy and problem solving in technology rich environments. It is part of the OECD’s Programme for the International Assessment of Adult Competencies (PIAAC).
The survey was undertaken in New Zealand in 2014 with a nationally representative sample of 6,177 adults aged 16 to 65. It was conducted in English and included an extensive background questionnaire covering education, employment, and the use of skills at work and in everyday life. The respondents were then tested on their skills.
The survey measures skills on continuous scales which show the range of abilities from being able to deal with simpler through to more complex tasks. The survey does not measure whether people ‘pass’ or ‘fail’ certain standards, nor whether people are ‘literate’, ‘illiterate’, ‘numerate’ or ‘innumerate’.
The scales can be divided into levels to group people within similar ranges of ability. These levels help describe the kinds of tasks these groups of people can do. However, the levels, on their own, do not describe benchmarks or thresholds for participation in society and the economy.
Key findings
South and East Auckland has the lowest English-language-based skills in the country, with nearly double the proportion of the population with low skills than all of New Zealand. This is largely a result of the high proportion of the population who do not have English as a first language. South and East Auckland is only slightly below the national average for educational achievement and ICT use at work.
The Wellington region has the highest skills in the country. The proportion of the population with high skills is around 50% higher than all of New Zealand. This is largely a result of the higher proportion of the population with degrees or above.
North and Central Auckland is similar to Wellington in terms of education and ICT use. However, North and Central Auckland has a higher proportion of the population for whom English is not a first language. This results in lower average skills in English.
Outside of Wellington and Auckland, differences in skill levels between regions are largely a result of the education levels and skill levels of jobs (as indicated by the use of ICT at work).
Around 40% of people with low English-language-based skills live in Auckland. A further 20% live in the Waikato and Canterbury regions.
Around 20% of people with high English-language-based skills live in North and Central Auckland, followed by just under 20% in the Wellington region, and around 15% in the Canterbury region.
The territorial authority data follows similar patterns to the regional data. One exception is Central Otago/Queenstown and Dunedin stand out as having higher skilled populations. The former is likely to be due to Queenstown being a significant tourism centre, and the latter due to Dunedin’s university and polytechnic.
Regional and local profile tool
The regional and local profile tool provides results from the survey for regions and territorial authorities.
The regional results are shown by regional council, and larger areas within the Auckland region. Some regions have been combined due to the relatively small sample sizes in those regions. The larger areas within Auckland are based on community boards and follow a grouping adopted by the Auckland Council in their PIAAC report (Clark & Huang, 2018). The regional data shows unadjusted direct estimates from the Survey.
The territorial authority results include results by community boards within Auckland City. Some authorities and community boards have been combined due to the relatively small sample sizes in those areas. The territorial authority data was developed using small area estimation (Krenzke et al., 2018). This approach uses multivariate models to provide more reliable estimates of skill levels in small populations based on the survey results. The results for territorial authorities are limited to the population with low or higher skills in literacy or numeracy.
The tool provides both maps and bar charts. The bar charts show the areas in descending order of the selected indicator and include the margin of error for each area. You can choose between:
- The proportion of the population within each area (For example, the proportion of the population living in an area with low literacy)
- The distribution of the population across areas (For example, the proportion of all people in New Zealand with low literacy who live in each area)
These are the views of the data provided in the tool:
- Skill levels by region: this view shows the the population in each region that has low or high skills in literacy, numeracy or problem solving.
- Average skills score by region: this view shows the average score for each region on each of the three continuous skill scales.
- Related variables by region: this view shows the the population in each region with low and high levels of education, low and high levels of use of ICT at work and not having English as a first language. These were identified in previous research as factors strongly related to literacy and numeracy in English (Lane, 2010).
- Compare skill levels with other variables: these two views provide comparisons by region of skill levels with other variables – one using maps and the other using bar charts. You can choose a skill domain and level on the left hand side and look at how this relates to one of the other variables on the right hand side.
- Compare regions with all of New Zealand: this view shows all of the skill and other indicators for a selected region and compares them with all of New Zealand. It illustrates the extent to which the related variables differ across regions.
- Skill levels by Territorial Authority: this view shows the population in each territorial authority with low or higher skills in literacy and numeracy.
- Tables: covering regions by skill levels and other variables, regions by detailed skill levels and territorial authorities by skill level.
The notes page in the tool includes information on the definitions used for low and high skills and other variables.
Other related research
The Auckland Council has produced a comprehensive analysis of literacy, numeracy and problem solving skills using the Survey of Adult Skills (Clark & Huang, 2018). Their report provides an overview of the results for Auckland, and outlines the differences in skill proficiencies between Auckland and the rest of New Zealand, as well as differences across geographic areas within Auckland.
The Ministry of Education explored the geographical distribution of literacy and numeracy skills among people aged 25 to 65 using data from the previous 2006 adult skills survey (Lane, 2010). The report found that three key factors provided a good account of the distribution of high and low literacy and numeracy: computer use, especially at work; completed education and first language (English or not).
Data limitations
The sample for the Survey was designed to represent 16 to 65 year olds across New Zealand. It was not designed to be to fully represent people within a region or territorial authority. It is possible that some groups may not have been sampled to the same extent in each area and this could affect the results.
The size of the sample means that there is a fairly large margin of error for each area. This needs to be taken into account in drawing conclusions about the differences between areas.
Each area shown in this tool is likely to have variation within it. There are likely to be smaller areas of lower and higher skill within each area, which are averaged out in the results.
References
- Clark, A., & Huang, T. (2018). Survey of Adult Skills : Results for Auckland (Technical Report No. 2018/007). Auckland.
- Krenzke, T., Mohadjer, L., Li, J., Van de Kerckhove, , Li, L., Ren, W., & Adbaru, H. (2018). Programme for the International Assessment of Adult Competencies, small area estimation., Rockville, Maryland.
- Lane, C. (2010). Adult literacy and numeracy in New Zealand – A regional analysis. Wellington.
Navigation
Related pages
Contact us
For more information about the content on this webpage, please email the Tertiary Mailbox